
A register and a diary
Two pages in the same dashboard, built from the same type and the same colours, that look almost nothing alike. The difference is not decoration. One answers what exists; the other answers what happened, and those questions want opposite shapes.
Most cultivation software renders everything as the same thing: a grid of cards with a number on each. It is easy to build and it flattens two genuinely different jobs into one. We ended up with two distinct display languages, and it was not a style decision — each one fell out of what its page had to be honest about.
The Grow page is a register
Grow is where the spaces and the runs live; strains have a page of their own, built the same way. It is an index of what the device knows about, and it is deliberately not a story.
Every row and card opens with a short identifier in a monospace chip — SP-326 for a space, G-526 for a grow, STR-514 for a genetic entry. These are not database keys leaking into the interface. They are short enough to say out loud, they sort, and they give you something to point at when a plant, a space and a run all share a name. Dates are set in the same monospace face. The effect is deliberate: monospace reads as a record, and proportional type reads as a claim, and we use that distinction consistently throughout the dashboard.
Status is a pill, and the vocabulary is deliberately tiny: ACTIVE, INDOOR, DRY, Community. A pill either says one of a handful of known words or it is absent. There is no partially-filled indicator anywhere on the page, because a space either is a dry room or it is not, and inventing a gradient would be inventing information.
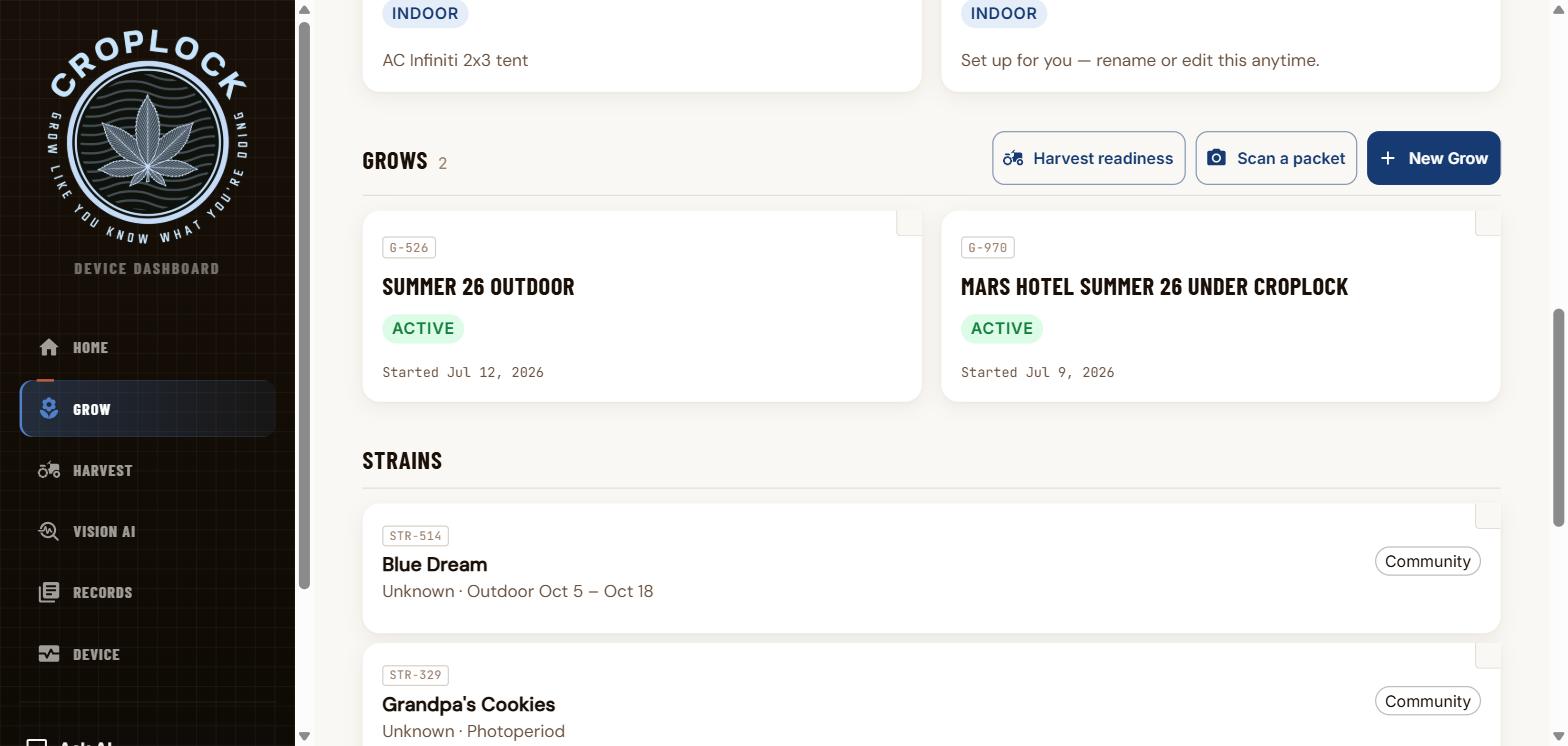
The one thing that gets typographic weight is the count that actually matters. In the top right of the page a single numeral sits at roughly six times body size, with three small capitalised words underneath it: grows under watch. Not a total, not a rolled-up score — the number of grows the device is currently responsible for. Everything else on the page is deliberately quieter than that.
What the register does not do is interpret. It will not tell you a space is doing well. It lists.
The Vision AI page is a diary
The camera page had a harder problem, and the shape it needed took two attempts to find.
What the camera produces is a very long list of reads — hundreds of them, one every few minutes, most of which say nothing happened. Displayed as a table, that is unreadable. Displayed as a percentage, it is worse than unreadable: it invites a number nobody can act on. What a grower actually wants to know is a sequence: what did it see, when, and what did I do about it.
So the page opens with a countdown rather than a score. A large numeral gives the days since the last call, next to a plain-language verdict in condensed capitals — on the device we are writing this from, NOTHING CALLED, fifty-three days, seven hundred and sixty-one reads. Underneath it, four small tiles carry the whole of that period’s bookkeeping: how many reads today, how many where nothing stood out, how many were withheld, how many the camera could not read at all. To the right, the most recent frame, captioned with the plant’s name and the date.
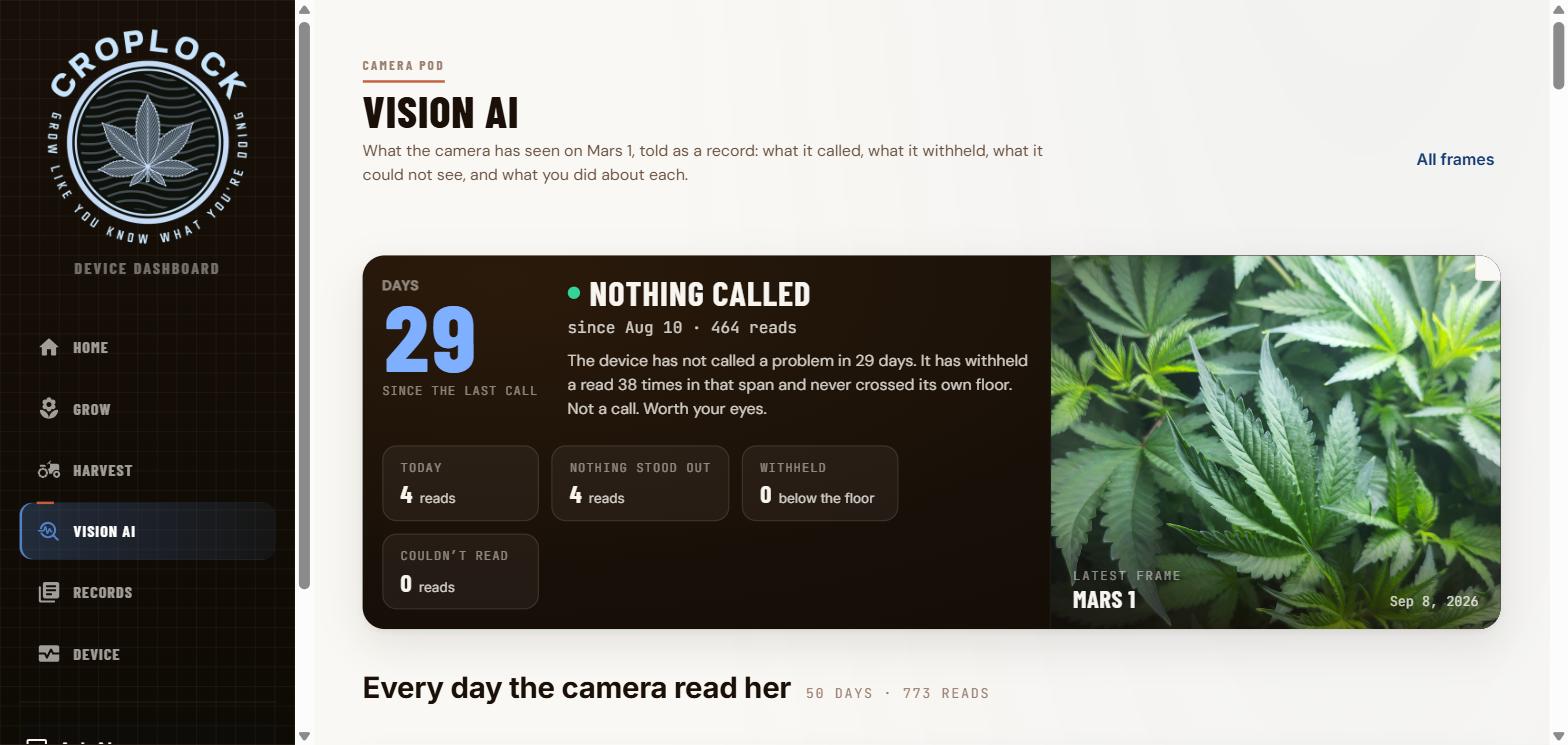
The important part is the fourth tile.
Four states, not two
Nearly every detection product in existence has two display states: it found something, or it did not. That is a lie of omission, because it silently merges two very different situations — I looked and there is nothing there and I looked and I could not tell.
This page separates them, and gives each one a labelled chip in the record:
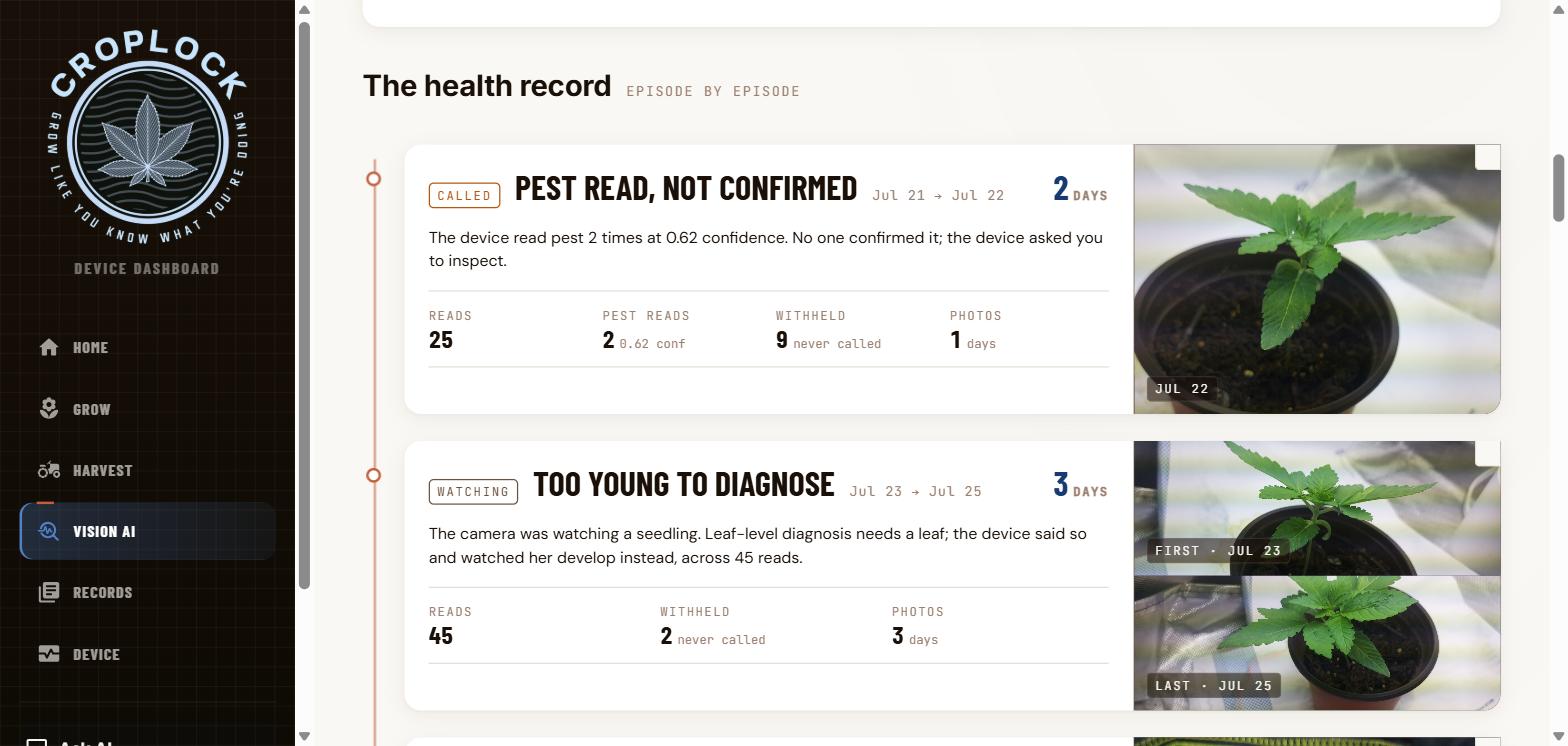
- Called — a read named a category above the device’s own floor. Whether that became a diagnosis is a separate line in the same block: the record says whether you confirmed it, dismissed it, or nobody did. The episode titles are literally “read, and you called it” and “read, not confirmed.”
- Watching — it is reading, but the conditions for a verdict are not met.
- Withheld — it saw something and stayed below its own floor deliberately.
- Couldn’t see — the frame did not support a judgement at all.
Giving abstention its own chip changes what the page is for. One episode on this device reads: the camera could not see — twelve days, during which 96% of a hundred and fifty-five reads came back “couldn’t read this leaf confidently enough to call it.” A conventional interface would render that stretch as twelve quiet days of nothing wrong. Here it is a labelled, dated block that says, in as many words, that every verdict the device refused to make in that window was the right refusal.
That first distinction is load-bearing, and it is worth being blunt about why. On the device these screenshots come from, the hourly camera pass has never once named a deficiency on its own — over one nine-day stretch it looked a hundred and seventy-four times at a real problem on the newest growth and returned “nothing stood out” every time. We know that because the record above is the thing that told us. An interface that collapsed the machine’s reads and the grower’s conclusions into one word would have hidden it.
Another episode is titled too young to diagnose. Leaf-level diagnosis needs a leaf; the plant was a seedling; the device said so and watched her develop instead, across forty-five reads. That is not a failure state and it is not a success state. It is the honest one, and it needed somewhere to live.
Every claim carries its denominator
Each episode block is the same fixed arrangement, and the order never changes: a state chip, a headline in plain words, the date span, the length in days as a large numeral, one sentence of prose, then a row of counts, then the events, then photographs.
The row of counts is the part we would defend hardest. An episode does not say “deficiency detected.” It says 106 reads · 6 deficiency reads at 0.68 confidence · 3 withheld · 5 days with photos. You are never shown a finding without the number of observations it came out of and the confidence attached to it. Six reads out of a hundred and six is a different fact from six out of eight, and an interface that shows you only the six has made a decision on your behalf that it was not entitled to make.
The photographs work the same way. Each episode carries its first and last frame, each stamped with its date. Two images, days apart, are the cheapest possible way to let someone check the machine’s claim with their own eyes — and, if it was wrong, to see that immediately. They are evidence, not decoration.
The grower is in the record
The detail that took the longest to get right: the episodes are named by what the person did, not by what the model output.
One block on this device is headed flags you dismissed as false alarms — nine deficiency flags across five days, looked at and ruled out, with each dismissal listed by date. Another is deficiency read, and you called it: the device read it six times, and the grower walked the interview and made the call. The machine’s reads and the human’s decisions sit in one timeline, at the same weight, in the order they happened.
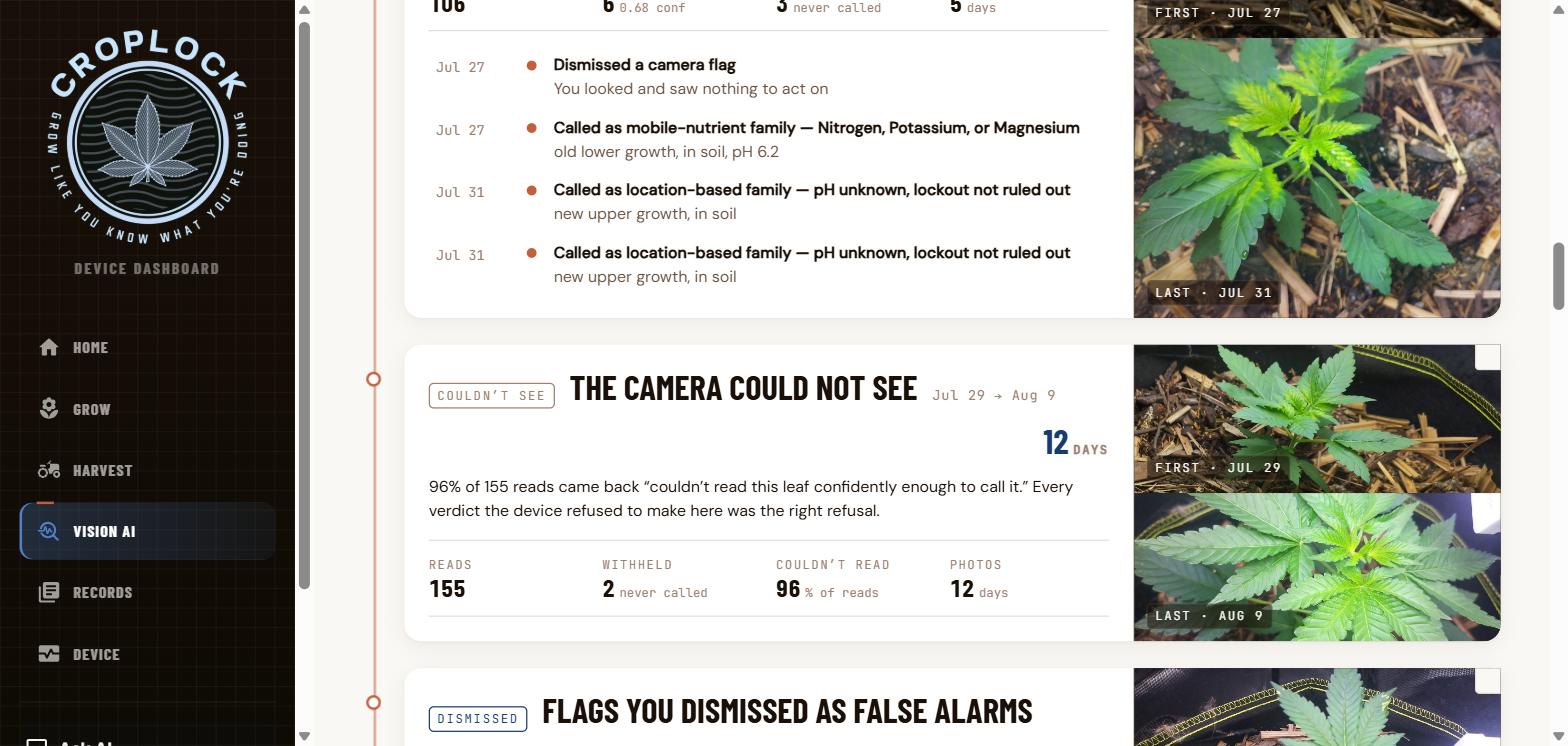
This matters more than it sounds. A device that shows only its own outputs is implicitly claiming to be the authority in the room. A device that records the grower overruling it is telling the truth about who is actually in charge — and it produces a record worth reading months later, when what you want to know is not what the camera thought but what you decided and why.
What the two pages share
Identical tokens throughout: one navy for anything numeric, one warm clay reserved for brand emphasis and the timeline rail, and green used only ever as a status colour and never as a brand one. Condensed capitals for structure, monospace for anything that is a record, proportional type for anything that is prose.
The rule underneath both, and the one worth taking away if nothing else is: a display style is a claim about what kind of thing it is showing you. A grid of cards claims the items are comparable. A percentage claims the underlying thing is measurable on one axis. A timeline claims that order matters. Pick the wrong one and the interface argues with the data even when every number in it is correct.
The register lists, because listing is all it is entitled to do. The diary narrates, because a sequence of observations across fifty days genuinely is a story, and the parts where the camera saw nothing are part of it.
All figures above are the live state of one bench device on 8 September 2026, read off the pages themselves. They describe how the record is presented; they are not a measurement of how often the diagnosis is right, which is a different claim requiring different evidence and is not made here.
Also read: Is it a deficiency or a disease? · Can trichome colour tell me when to harvest? · The whole run, as the device recorded it